Editor's note: This is the first blog post in a series of posts about analytics. If you're new to analytics, this is the perfect place to start! If you're already familiar with the basics of analytics and want to know how to get started using UiPath Insights to measure the impact of your automations then join Michelle for the webinar Product Spotlight: Maximize the Value of Your Automations with UiPath Insights.

If you’ve spent any time working with software, you’ve probably heard or seen the word “log” in some context or another. “Add it to the logs”, “check the logs,” “is it in the logs?,” etc., are some common phrases, especially in the context of Robotic Process Automation (RPA).
Now, you might be wondering, what do RPA and logs have to do with each other? Seems like a bit of a long shot, but RPA and logs have everything to do with each other when it comes to analyzing any of your data. Because they let us keep track of important pieces of information that can help you understand what’s happening with your Robots, Orchestrator, etc., we use logs as a basis for performing analytics.

Think about it this way: you (or your company) have just invested a ton of resources into robots, infrastructure, training, development, process identification, and a whole lot more! You’re going to want to know what’s going on with all of that—how are your robots doing, are you using them efficiently, are your automations running smoothly or do they keep erroring out? There’s not really an easy way to see this information from every level. Even developers can only really check what’s happening with their automations if they’re watching the automations run and checking the logs for each process. Essentially, you can’t get a holistic view in one place.
There are a few types of logs that UiPath generates, but we’re going to focus on Robot execution logs. Every time a robot runs a process, we make note of a few key fields:
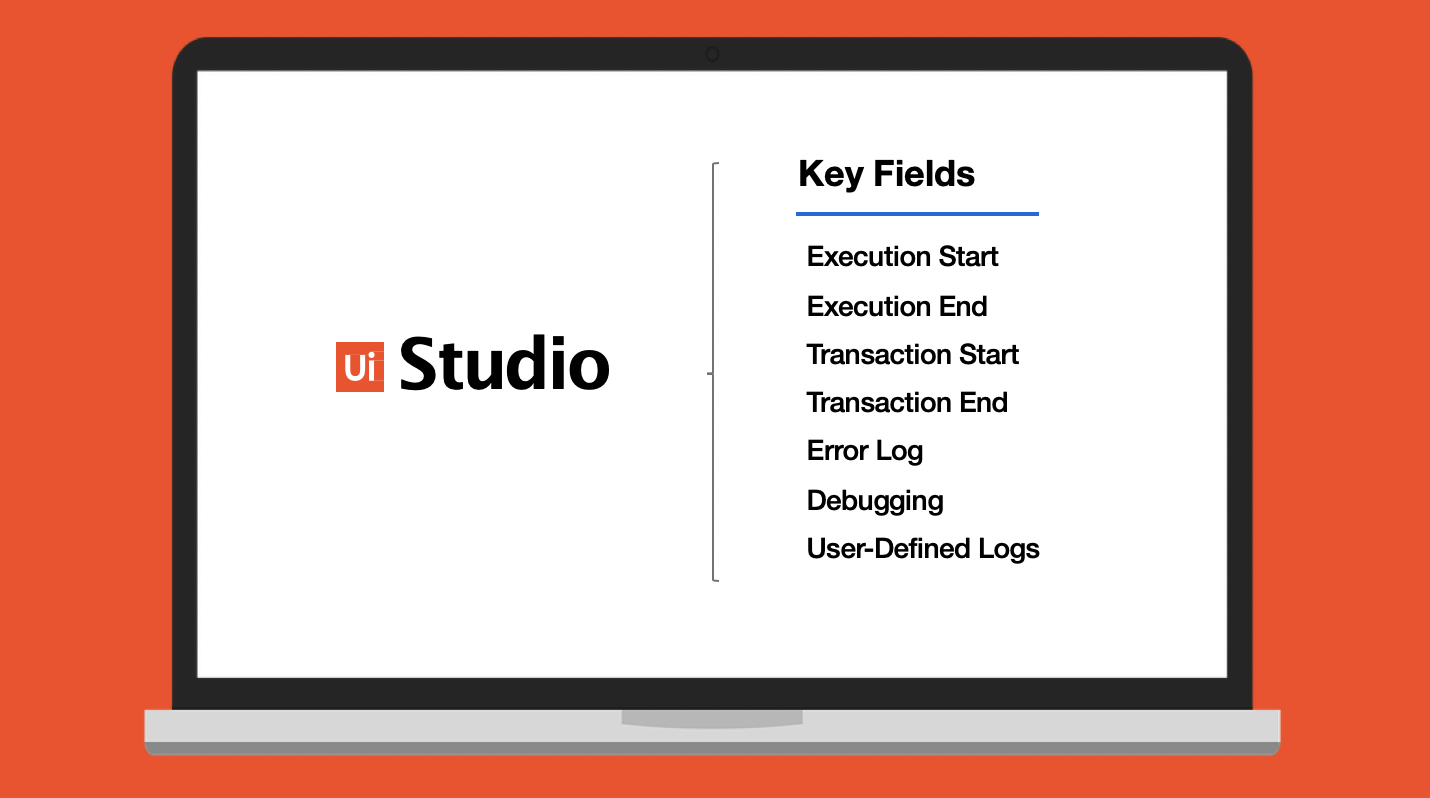
- 1. Execution Start - every time a process starts
- 2. Execution End - every time a process ends
- 3. Transaction Start - every time a transaction within a process starts (you’ll only see this when using queues)
- 4. Transaction End - every time a transaction within a process ends (you’ll only see this when using queues)
- 5. Error Log - every time an execution is stopped by an error
- 6. Debugging Log - if the Robot logging setting is set to Verbose. Contains activity names, types, variable values, arguments etc.
- 7. User-Defined Logs - using the Add Log Fields activity or the Log Message activity
These logs are in the form of a JSON, pretty much just a key-value pair (think “field1:value1,” “field2:value2”). They get sent to the UiPath Orchestrator, where a few extra fields are added:
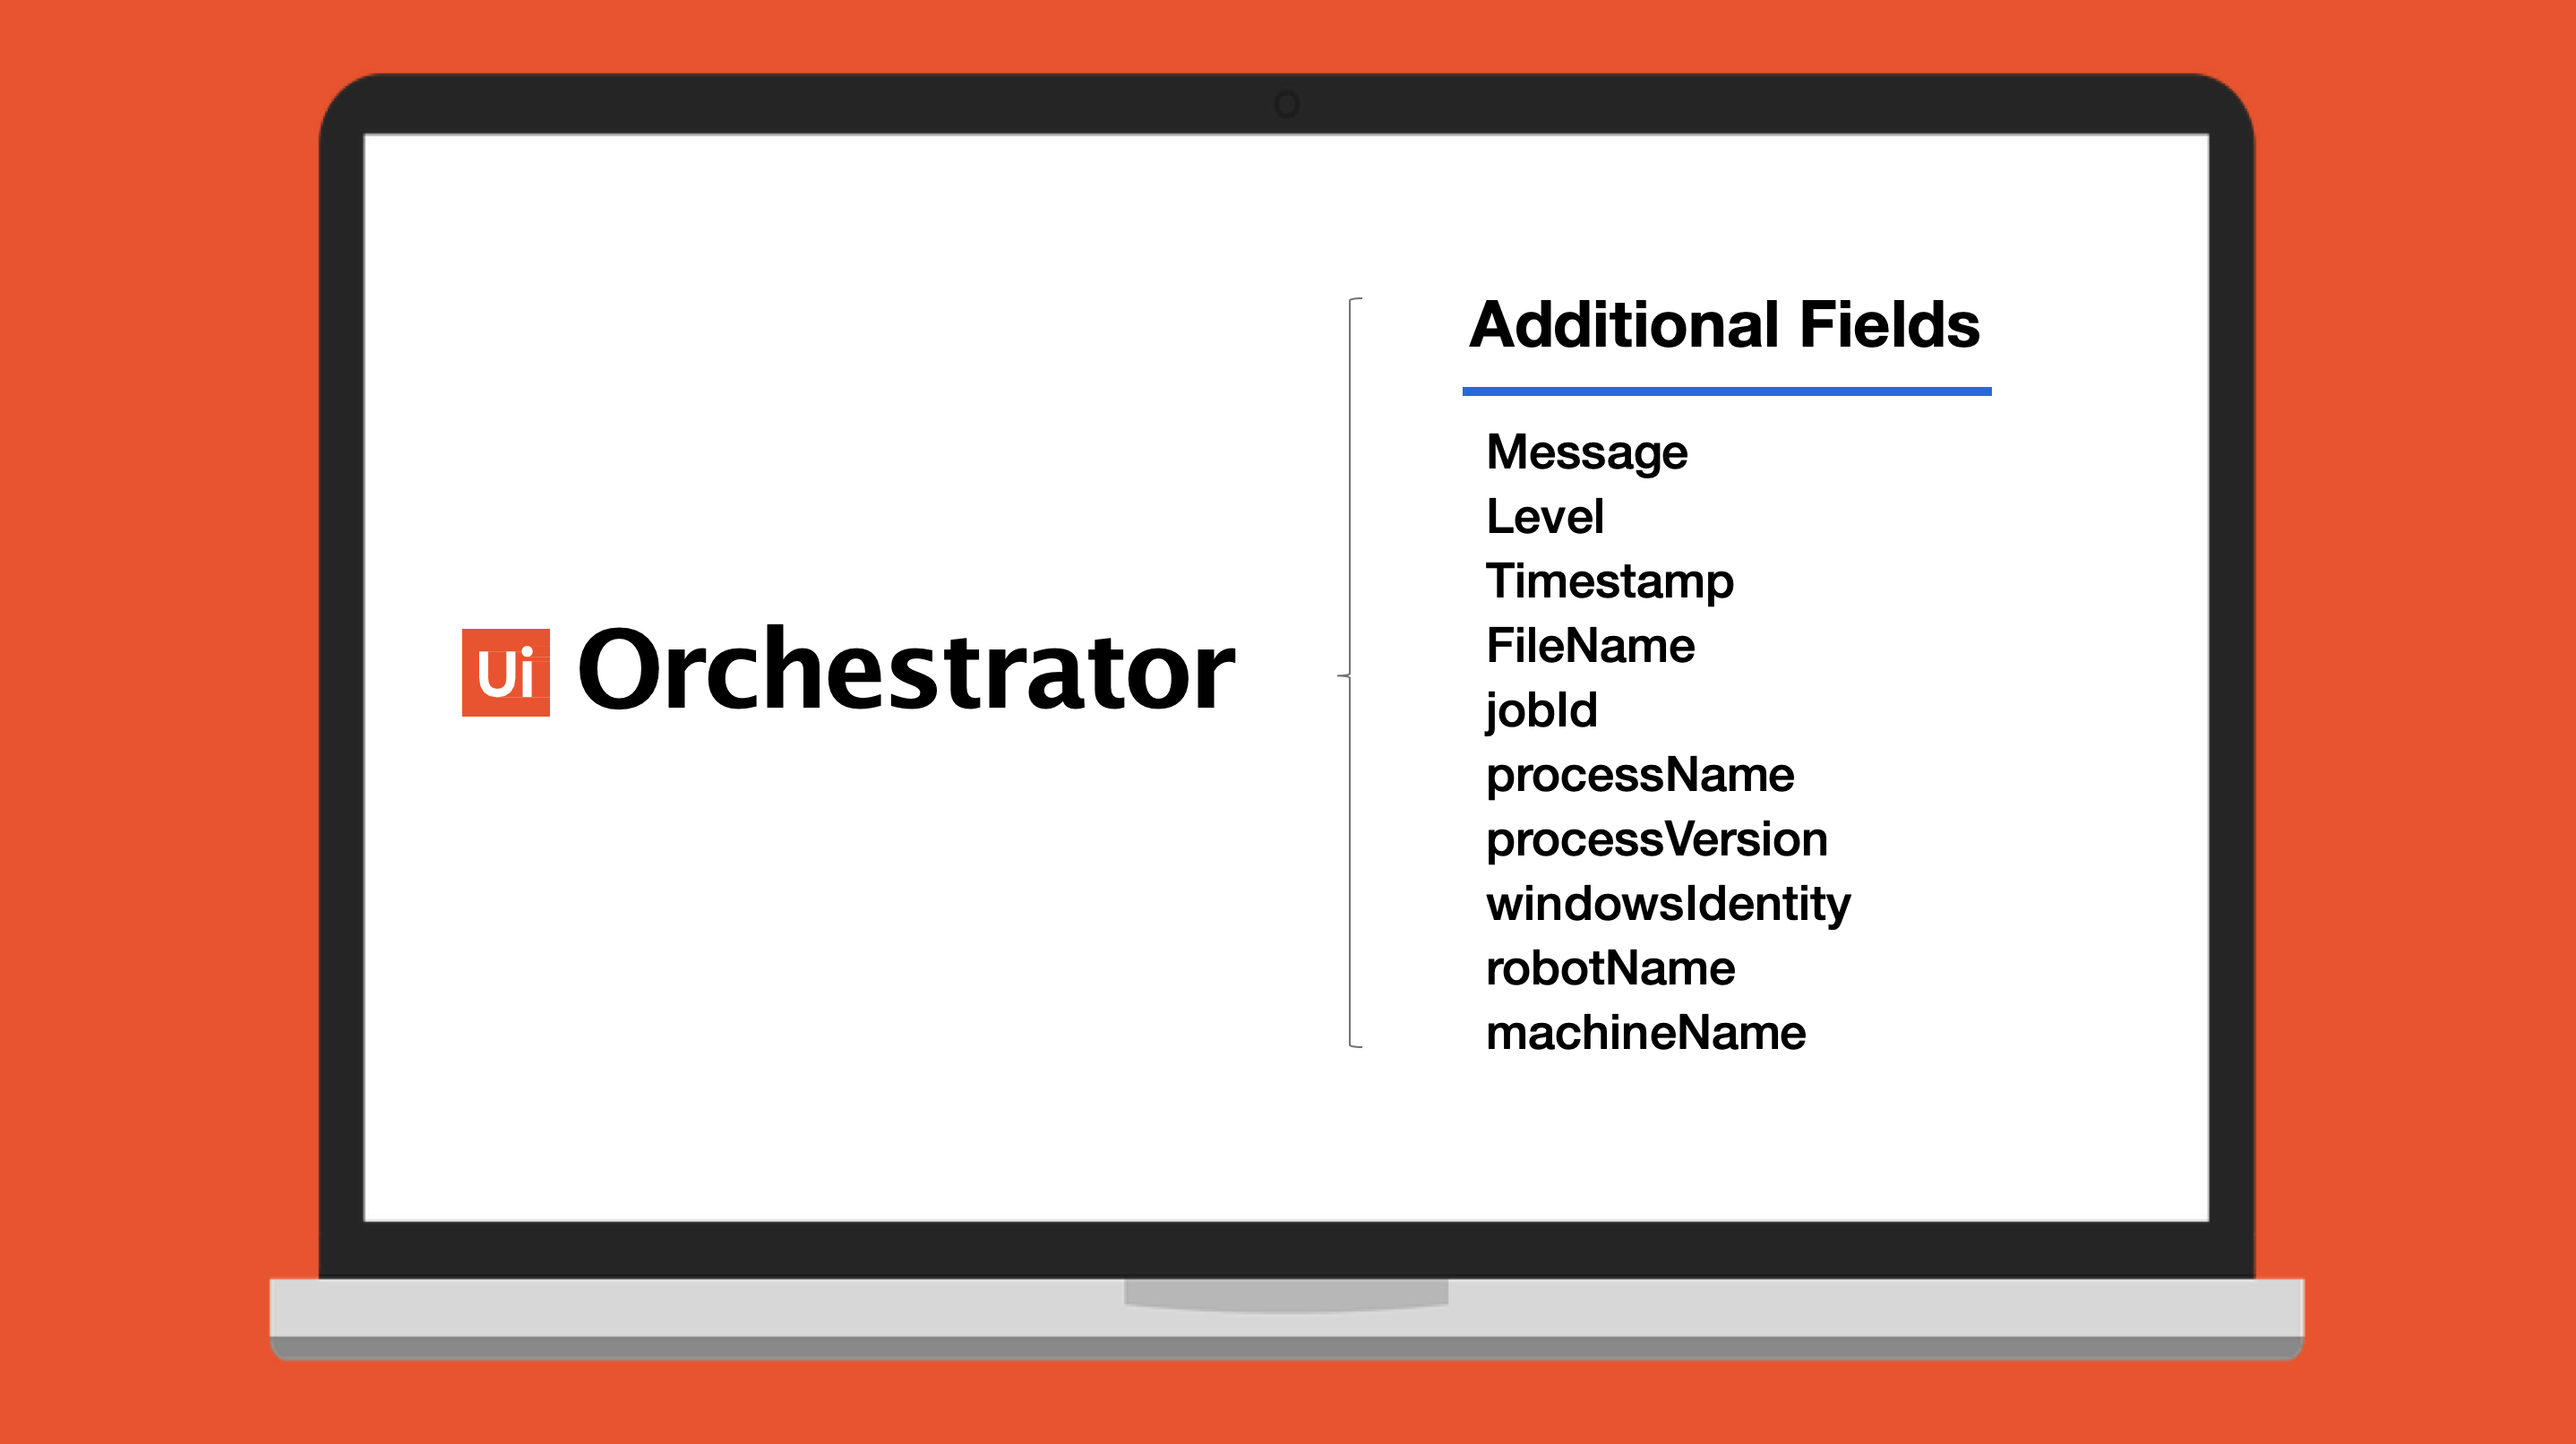
- 1. Message - Log Message
- 2. Level - log severity
- 3. Timestamp - date and time the action was performed
- 4. FileName - the .xaml file being “executed”
- 5. jobId - the key of the job running the process
- 6. processName - the name of the process
- 7. processVersion - the version of the process
- 8. windowsIdentity - the user that performed the action that was logged
- 9. robotName - the name of the Robot (defined in Orchestrator)
- 10. machineName - the name of the machine the Robot running the process was connected to
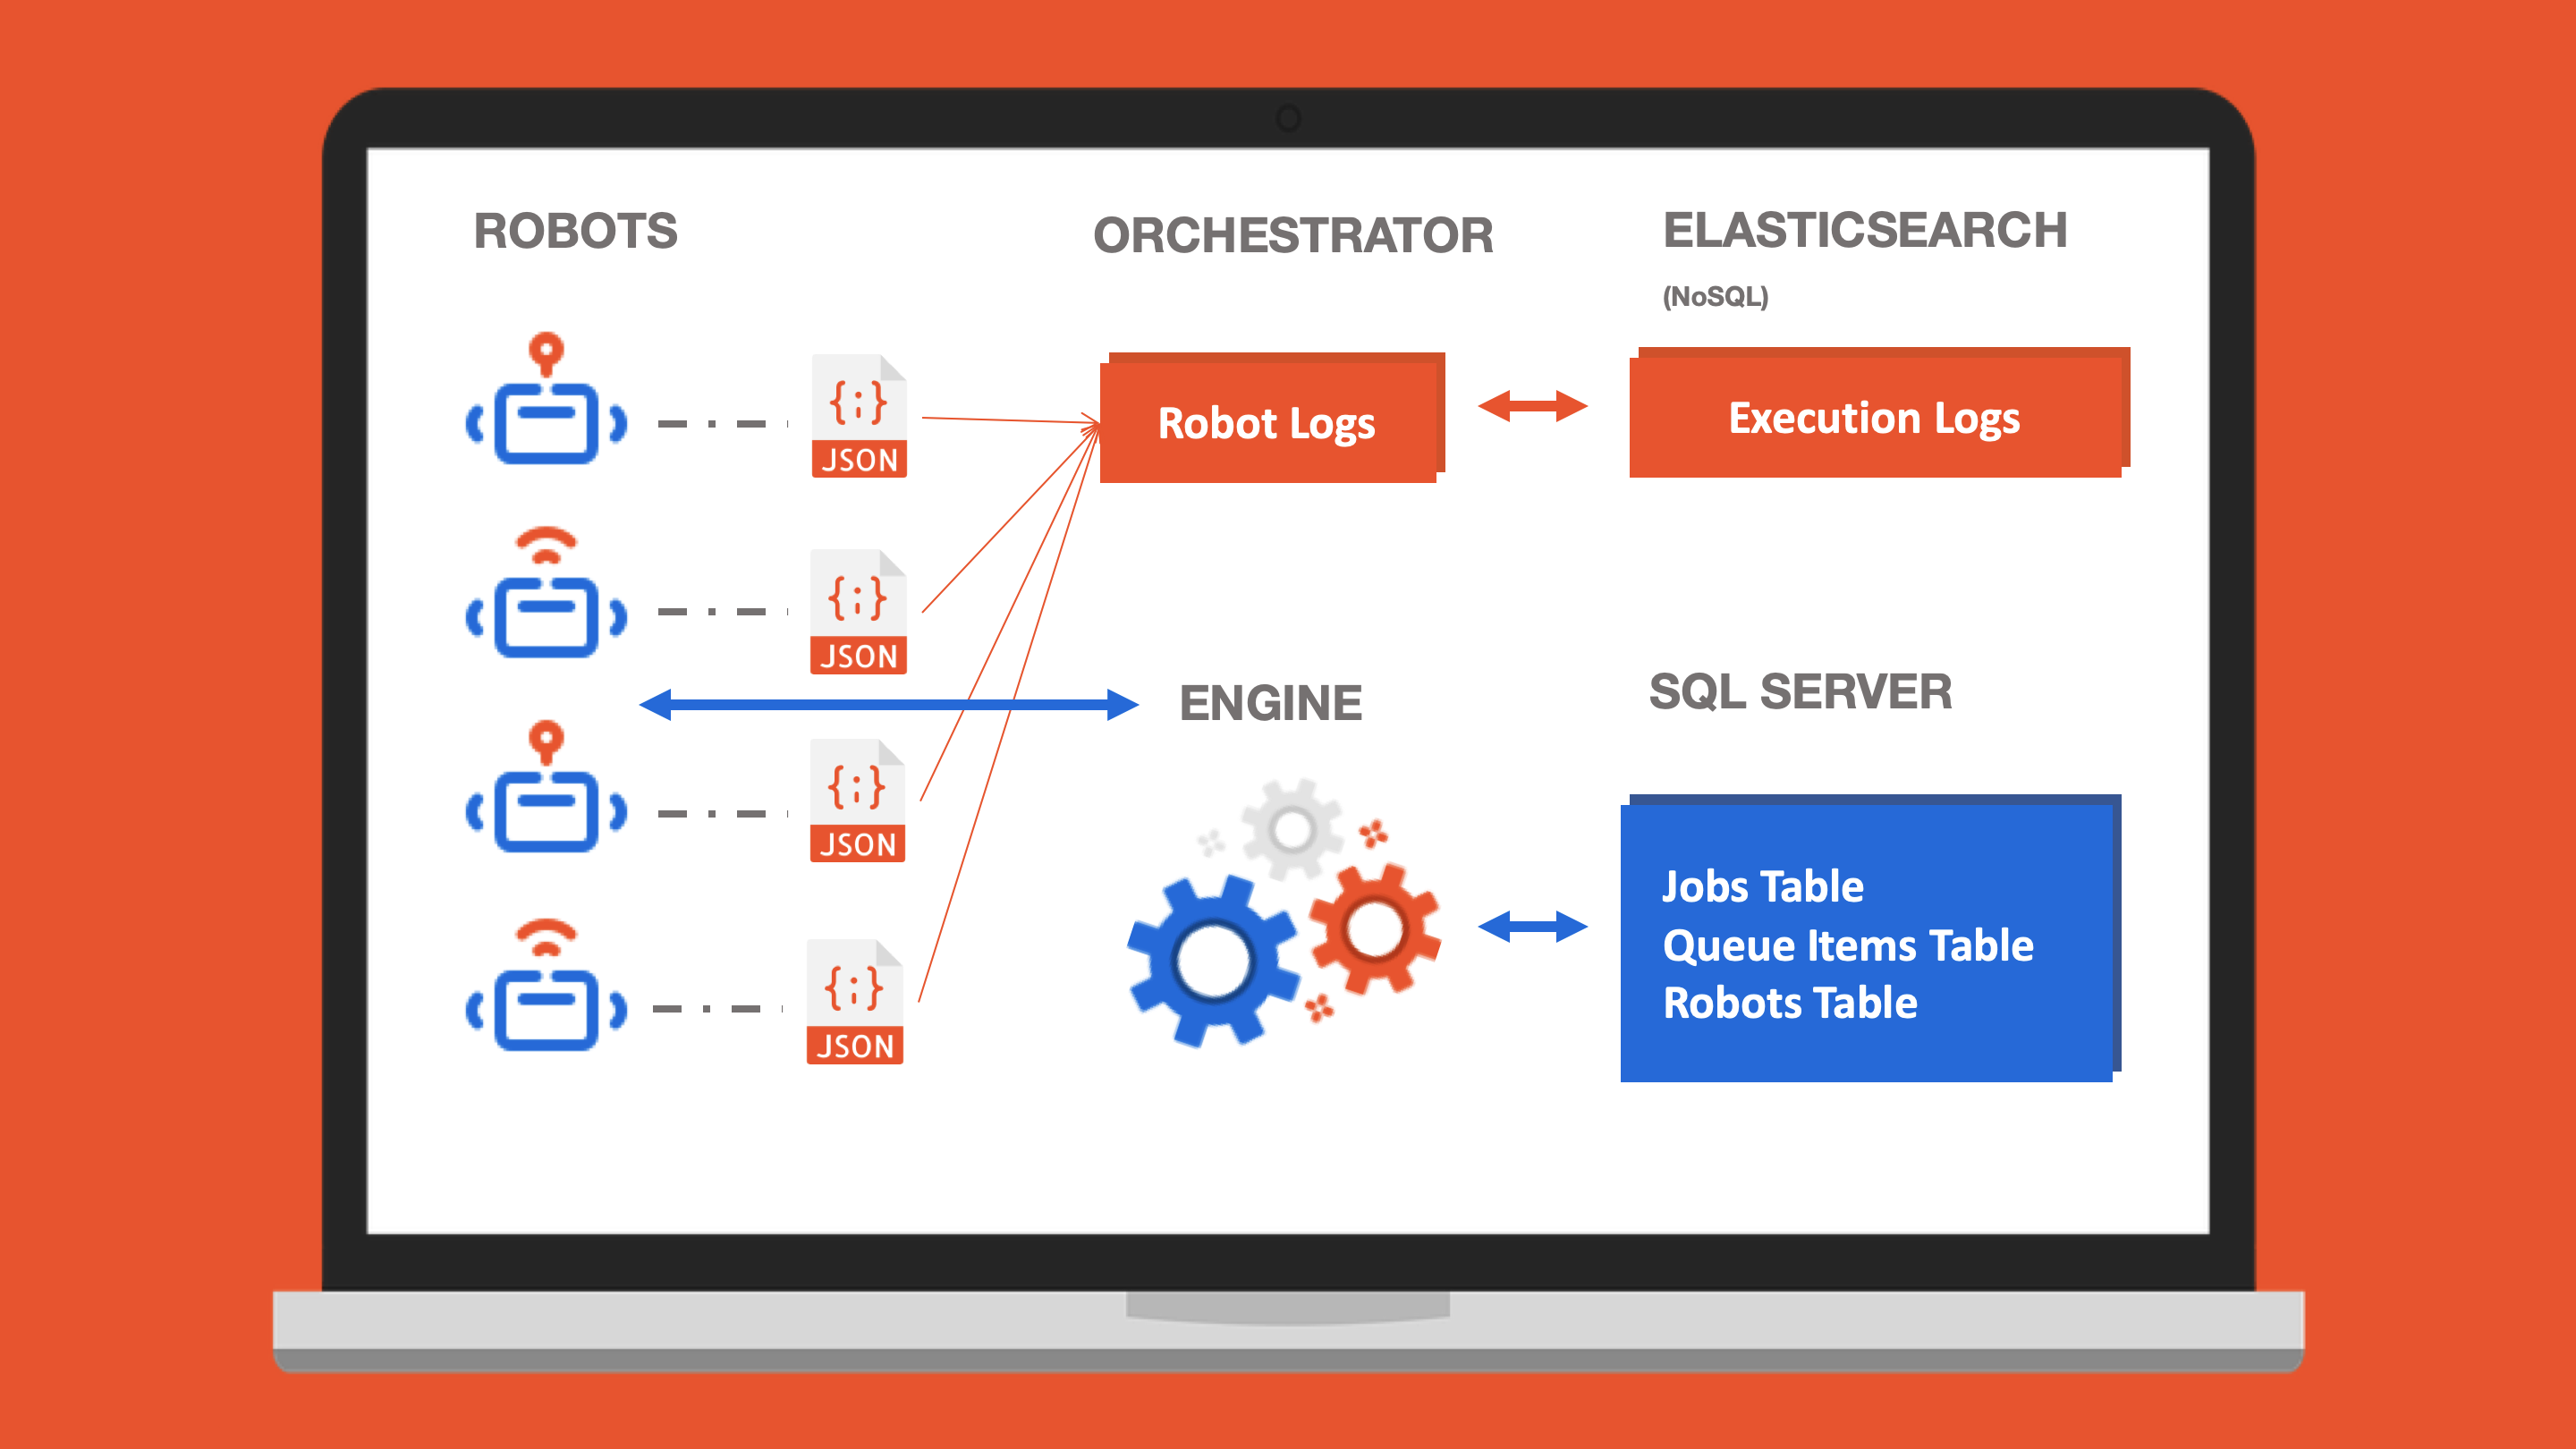
Once your logs are complete, you have a few options as to where you want them to go. By default, your logs will be sent to the SQL database that Orchestrator is backed by, as well as to Elasticsearch (assuming you have an Elasticsearch that you can connect to). We provide a “direct integration” with Elasticsearch because with a few simple changes to the web.config file that comes with Orchestrator, you can send your logs directly there (see our Orchestrator prereqs for more details about how to do this). You can choose to limit your logs to only SQL, only Elasticsearch, or neither! I wouldn’t recommend the latter approach since that data is important for any kind of analytics you’d like to do, but that’s completely up to you. Here’s a visual overview of the whole process:
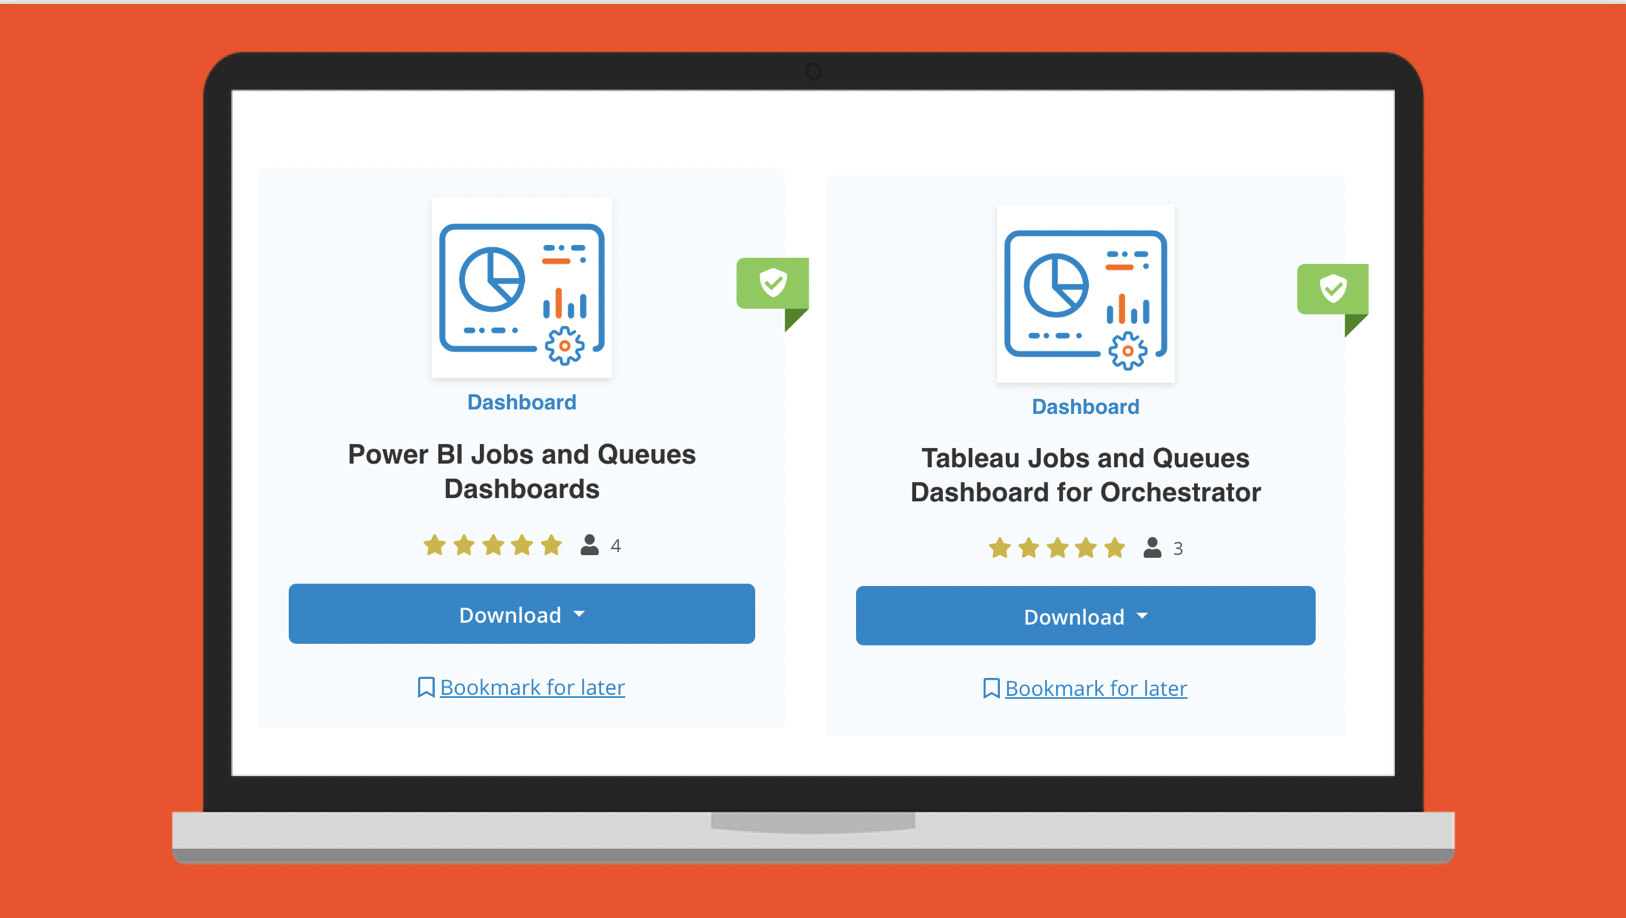
Now that we’ve covered where the logs come from, let’s touch on sending everything to the SQL Server. That’s a great choice if you’re looking at a tool like Power BI, Tableau, Qlik, etc. that is schema-based, meaning it expects a certain number of fields and a pattern among your data. We provide out-of-the-box (OOTB) dashboards for Power BI and Tableau on our online marketplace, UiPath Go! The two are almost identical, so you won’t be missing out regardless of which tool you choose. I built the first draft of the Power BI dashboards based on the layout of our Tableau dashboards, and then our BI director, Sorin Stania, made them a lot better. If you think they’re awesome, he’s the one you should thank.
There are, however, some important considerations to keep in mind when you choose the SQL-based approach. Our best practice for the number of records you should keep in SQL Server is 1-2 million records. For a lot of you with a larger deployment of Robots and processes, you’ll blow past this limit in just a few months. Once you start overloading the SQL, it’ll take longer to return results and you’ll start seeing performance impacts when you’re doing things on Orchestrator. To mitigate this a bit, we recommend using a mirror database, pretty much an exact copy of the original database to connect your BI tool to. This way, you won’t have two sources asking the database for information at the same time. You’ll see that things will still slow down when you load past our best practice recommendation, but at least you’ll keep demand lower per database.
When you have larger amounts of records and you have to wait for SQL to return queries, you start to sacrifice the “monitoring” aspect of analytics, because you can’t see things in real-time. That means that you’ll have to refresh your data on the BI tool anywhere from every minute if you have a smaller dataset, to once a day when you have a really large amount of records. Luckily, we released Monitoring as a part of Orchestrator in the 2019.4 release! You should check it out, it’s pretty neat and lets you see real-time insights into your Robots, jobs, and queues. Here’s a sneak peak of those insights!

One thing you need to keep in mind when reporting off of SQL is that it’s best for operational analytics, basically more of a health-check for how your deployment is going—how many processes you’ve run in a certain time, what your Robot utilization is, what your most common error is and which machine it’s happening on, etc. All of our OOTB dashboards that connect to SQL are awesome for that type of data.
If you’re looking for business outcomes, you’ll probably want to be ingesting some data custom to the sorts of processes you’re running. i.e. how many invoices have you processed, what’s the dollar value of the invoices you’ve processed, what type of invoices have the highest exception rate, and which vendor are they coming from. For metrics like that, you’re going to want to leverage those user-defined logs, via the add log fields activity.
That activity lets you add right on to your logs with your own field names and the appropriate values, making it super easy for you to build dashboards from them.
There’s a bit more to logging and deciding on whether SQL is the right data source for you, so check out my next post where I break down exactly what Elasticsearch is and when it’s more useful than SQL, touch on our NoSQL OOTB dashboard options, and show you how to best leverage custom logging.
Read next: RPA Reporting and Analytics 102: NoSQL and Logging for Business Metric
Michelle Yurovsky is a senior analytics product manager at UiPath.